Note: This is part of a series where I follow along with the ROS 2 Humble and Gazebo Fortress tutorials and demos. This is not original content.
Another quick one. We’ll take a quick look at the Gazebo GUI, following along step-by-step with this tutorial from the Gazebo docs.
Since we’re using Gazebo Fortress, we need to launch Gazebo using Ignition. First, check that you’ve got the correct version of Gazebo installed:
ign gazebo --version
Which in my case returns 6.16.0. Versions of Fortress should be in the 6.x.x family, so all is well.
Now, let’s launch Gazebo. In my case I have only one version installed, but it’s possible to have multiple versions. If you need to force a particular version to launch, you can do it like this:
ign gazebo --force-version 6.16.0 shapes.sdf
Keep in mind that which GUI elements you see (and their position and behavior) is determined by the contents of your .sdf file. For shapes.sdf, you should see something like this:
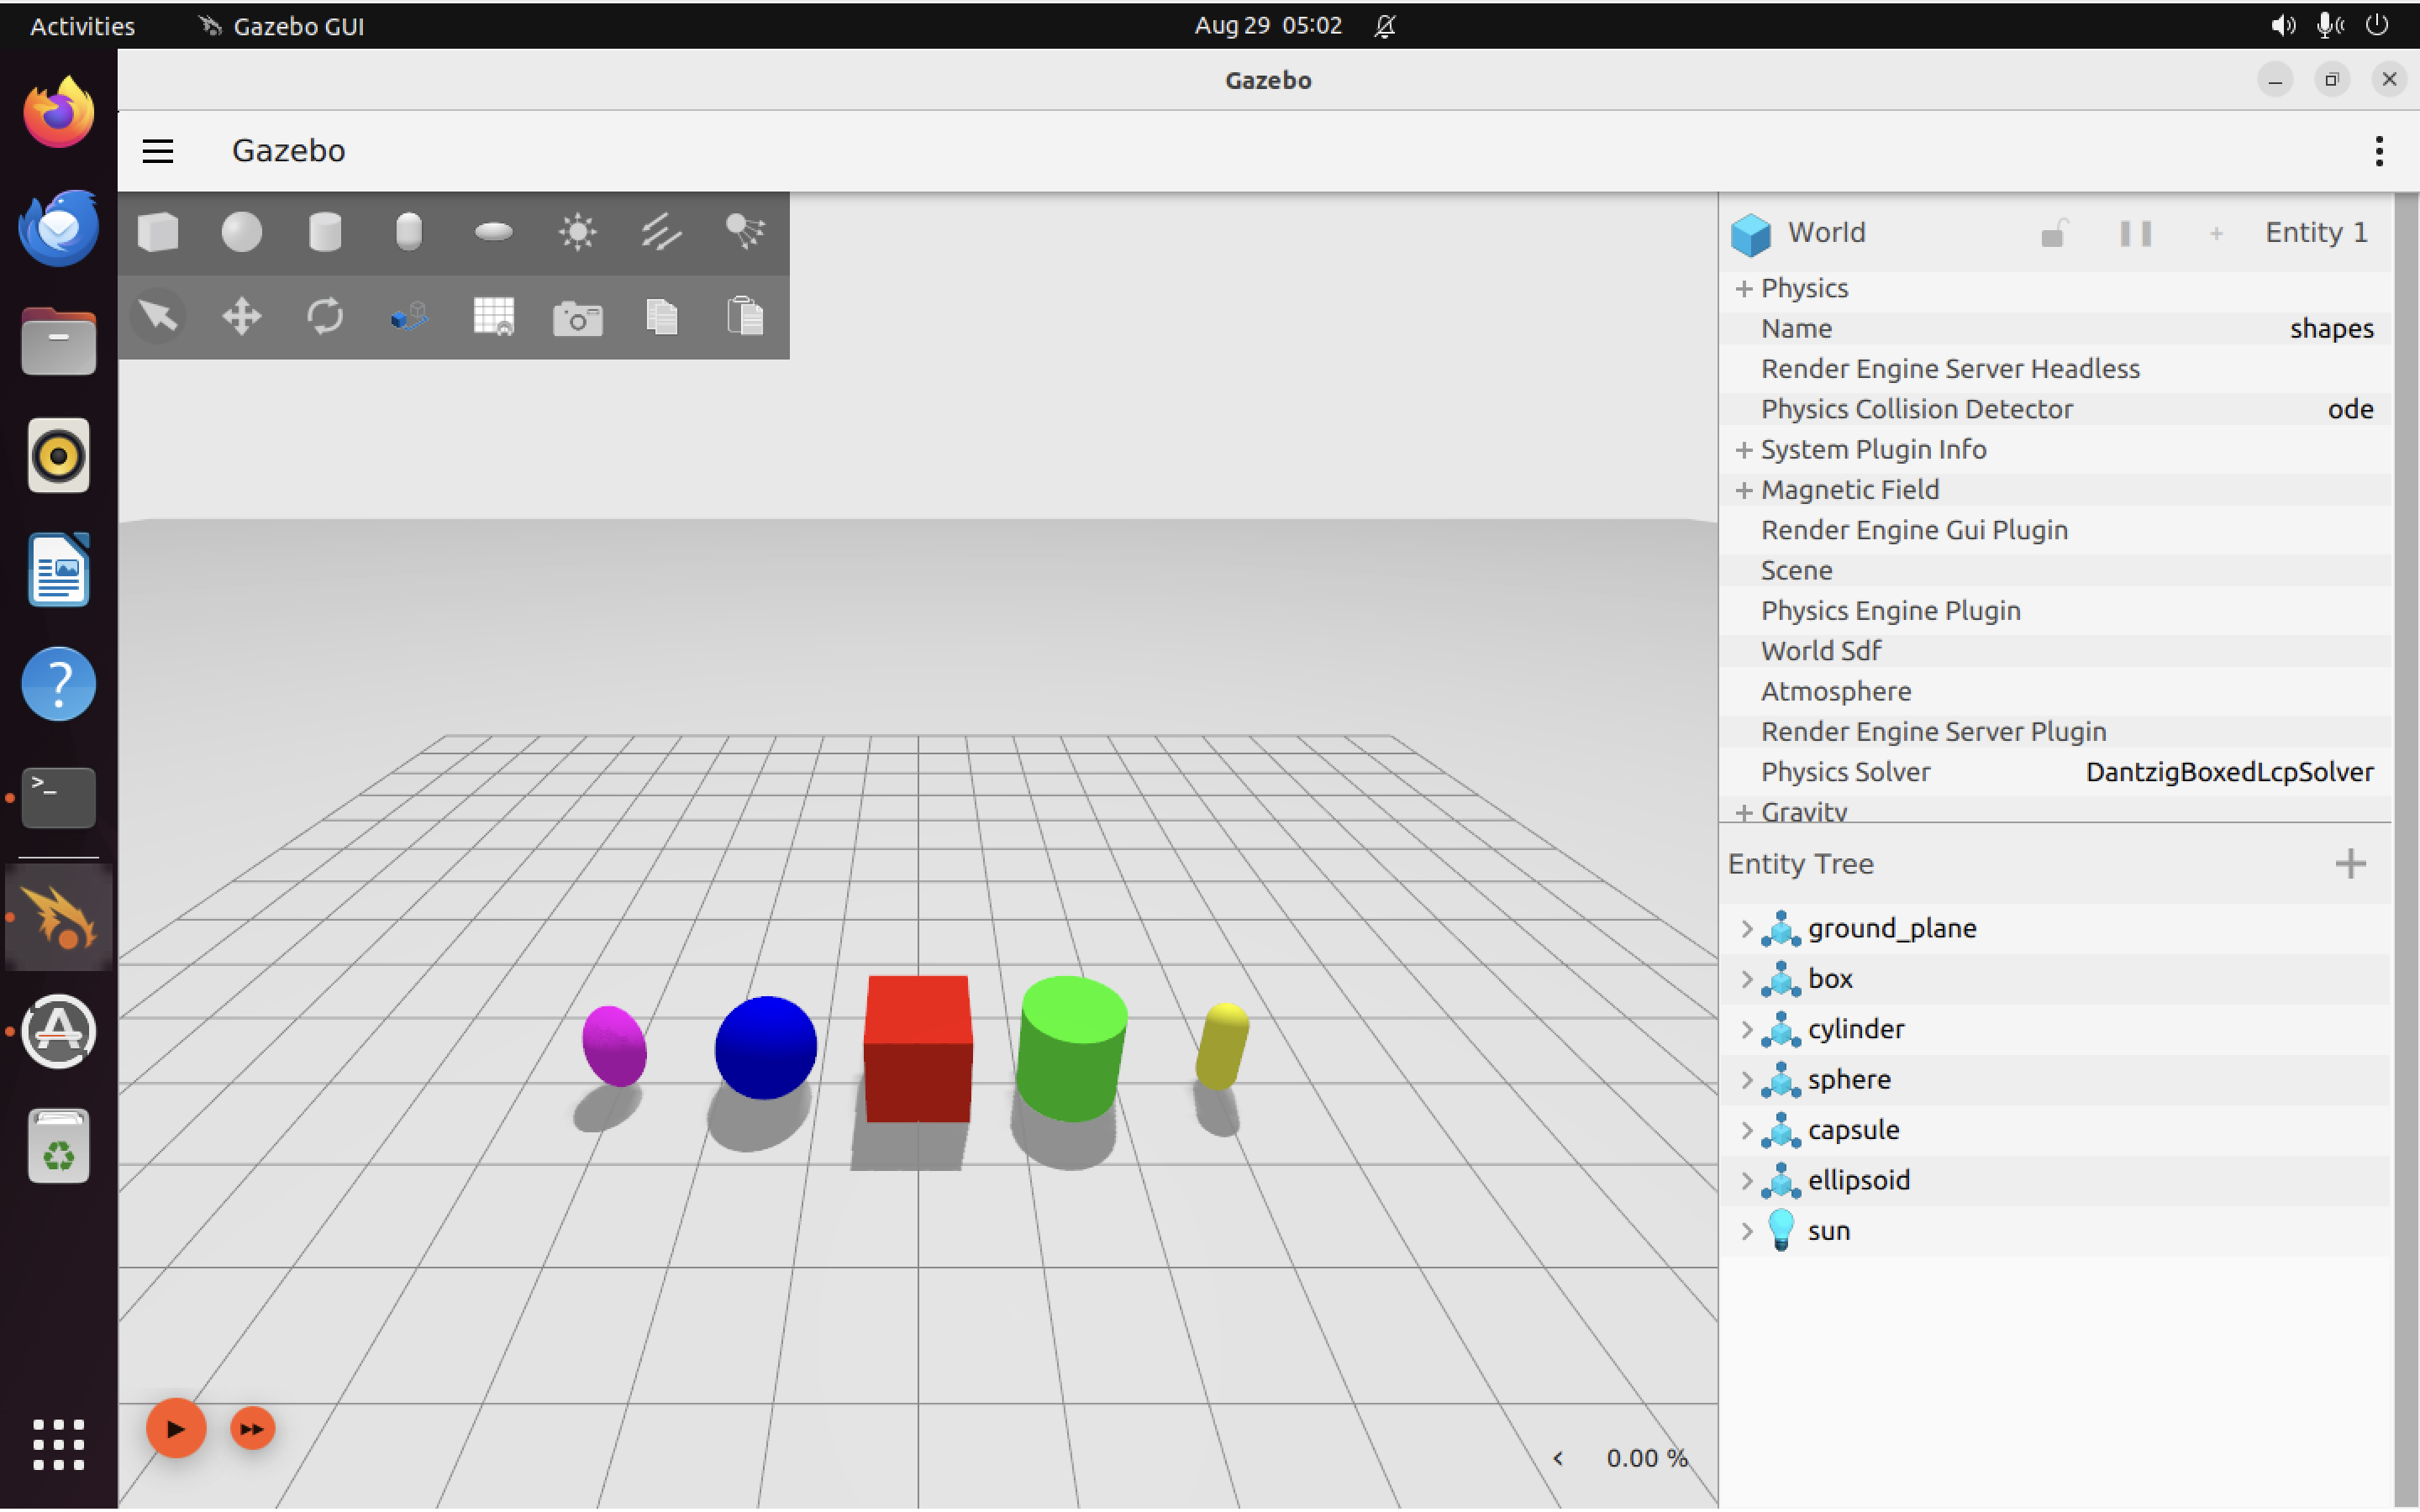
The Gazebo interface is broken down into a couple different sections.
Toolbar Link to heading
The main toolbar sits at the very top of the window. It spans the whole GUI horizontally from the left to the right.
The leftmost menu (three horizontal bars) lets you load and save world files and see information about the version of Gazebo you are running.
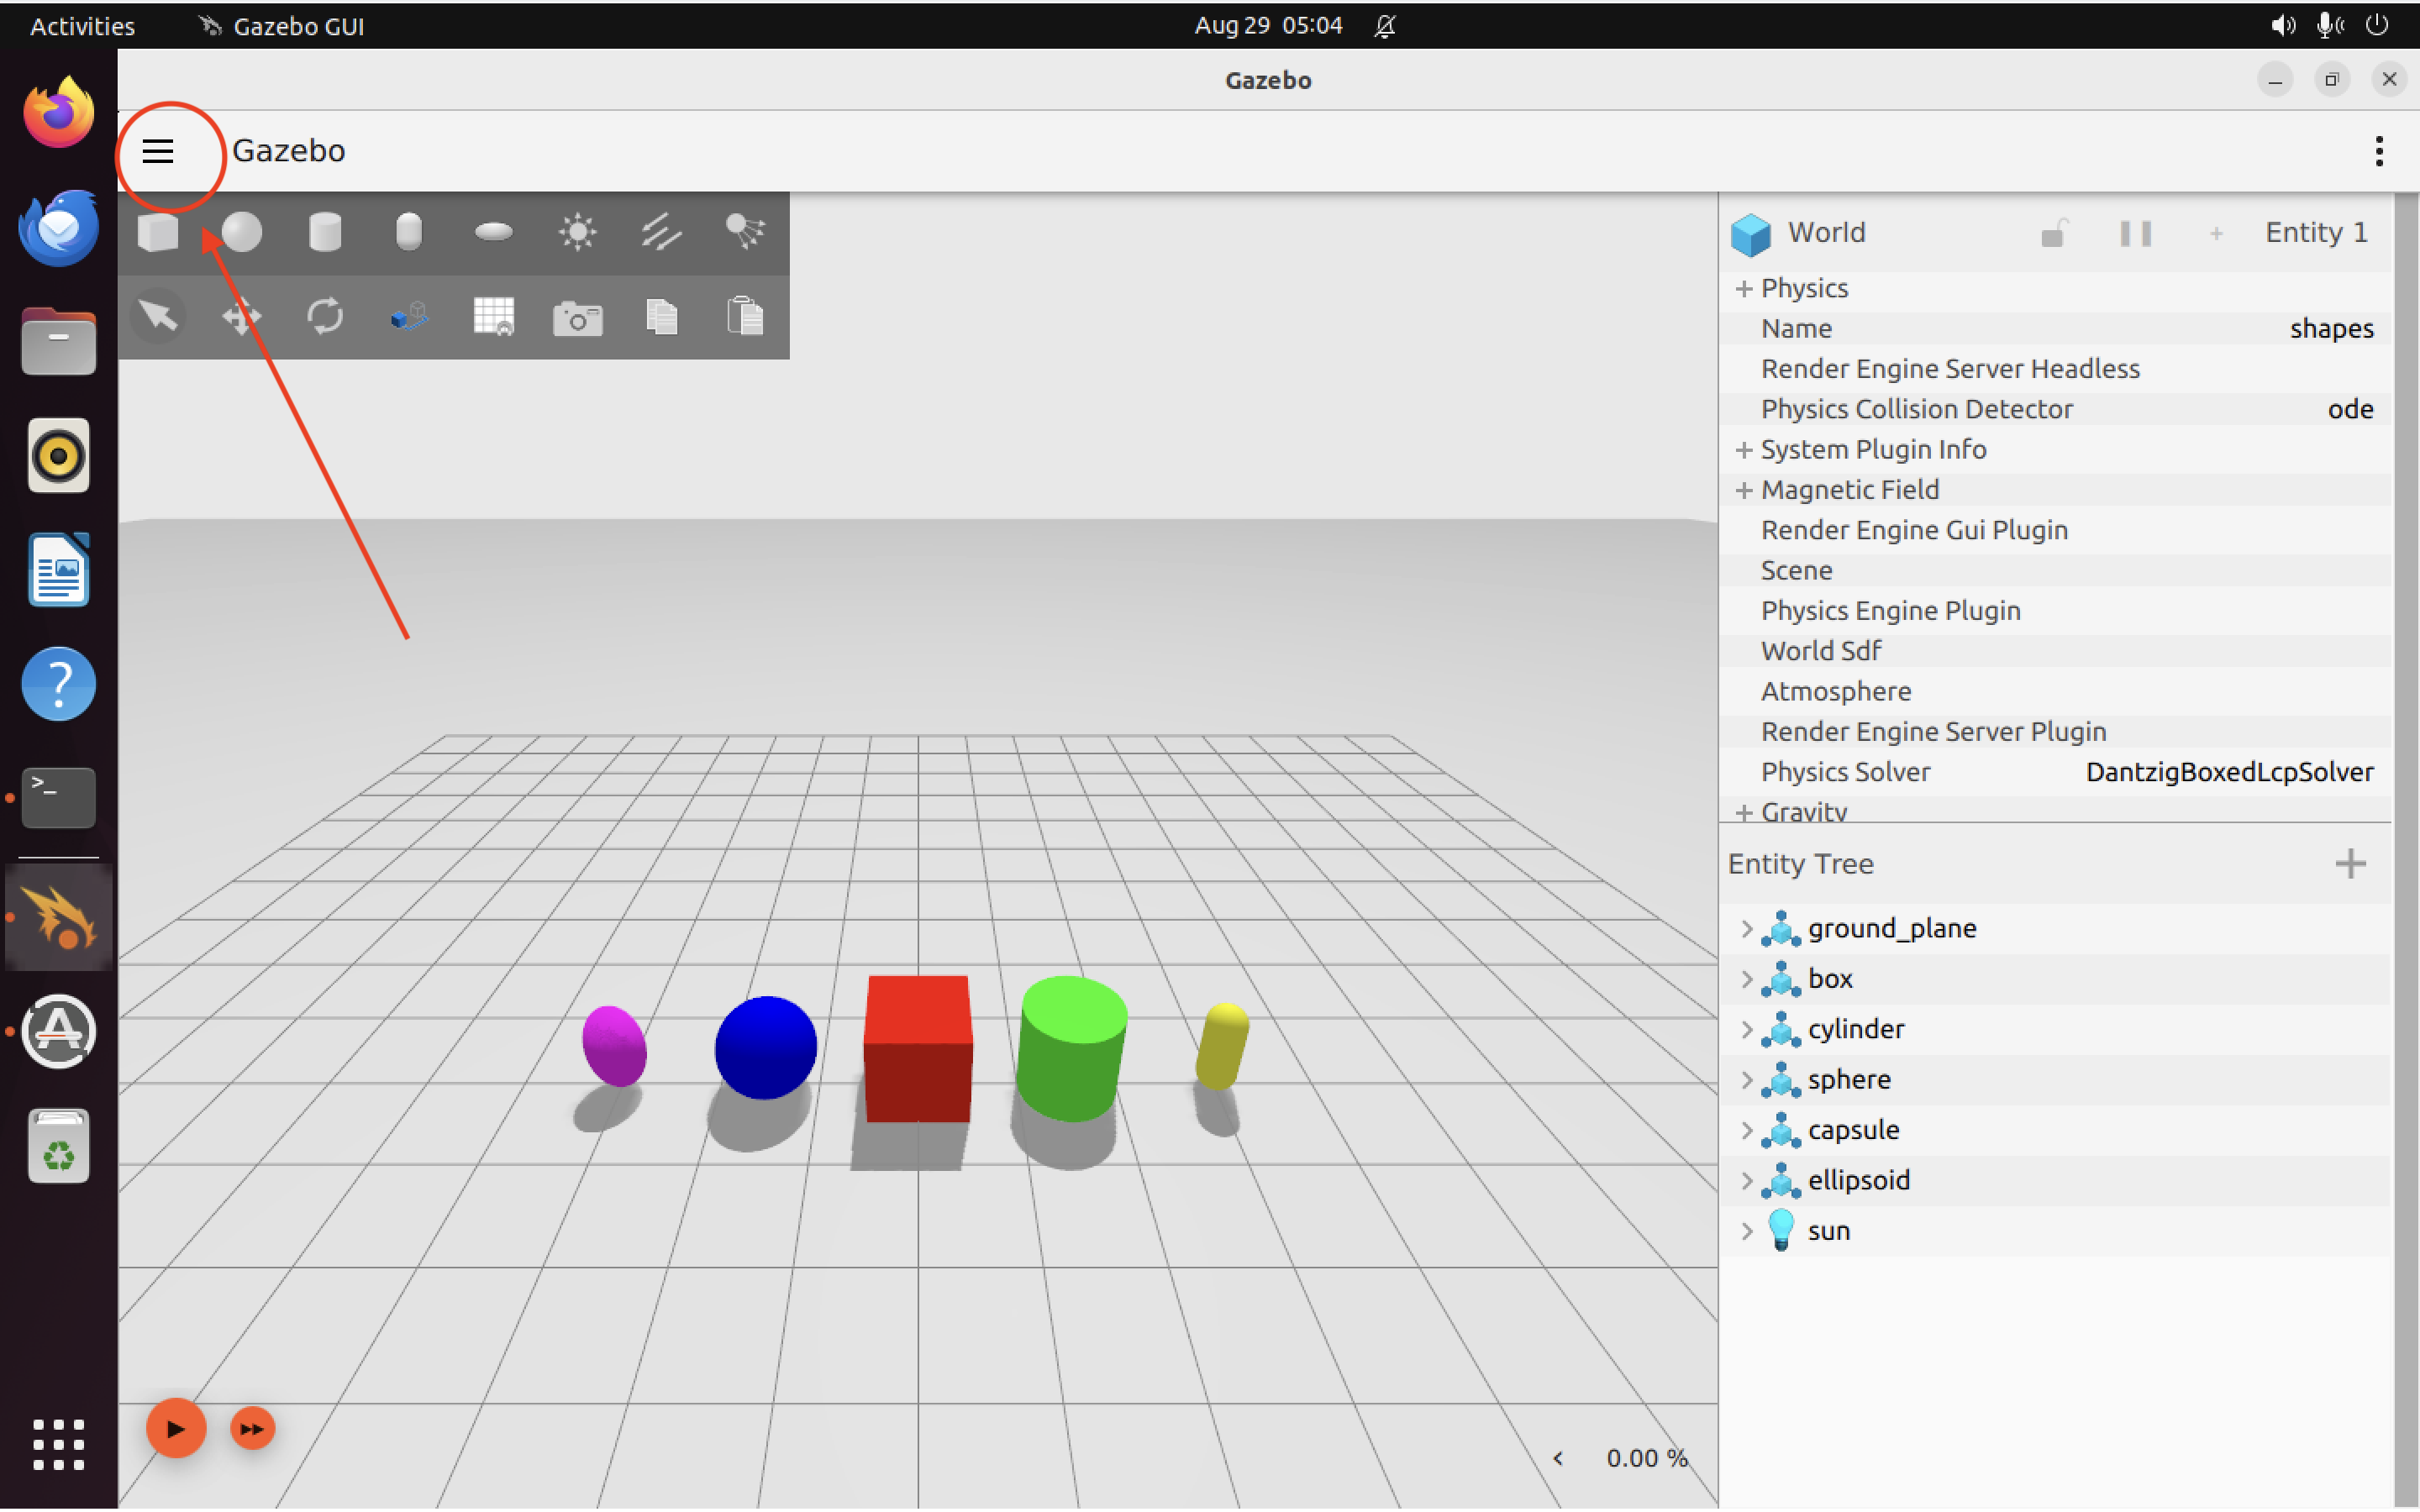

The leftmost menu also allows you to save your interface style settings and other configuration details, so you can re-load them later. This makes it easier to keep a consistent GUI experience even when you customize things to your own liking.
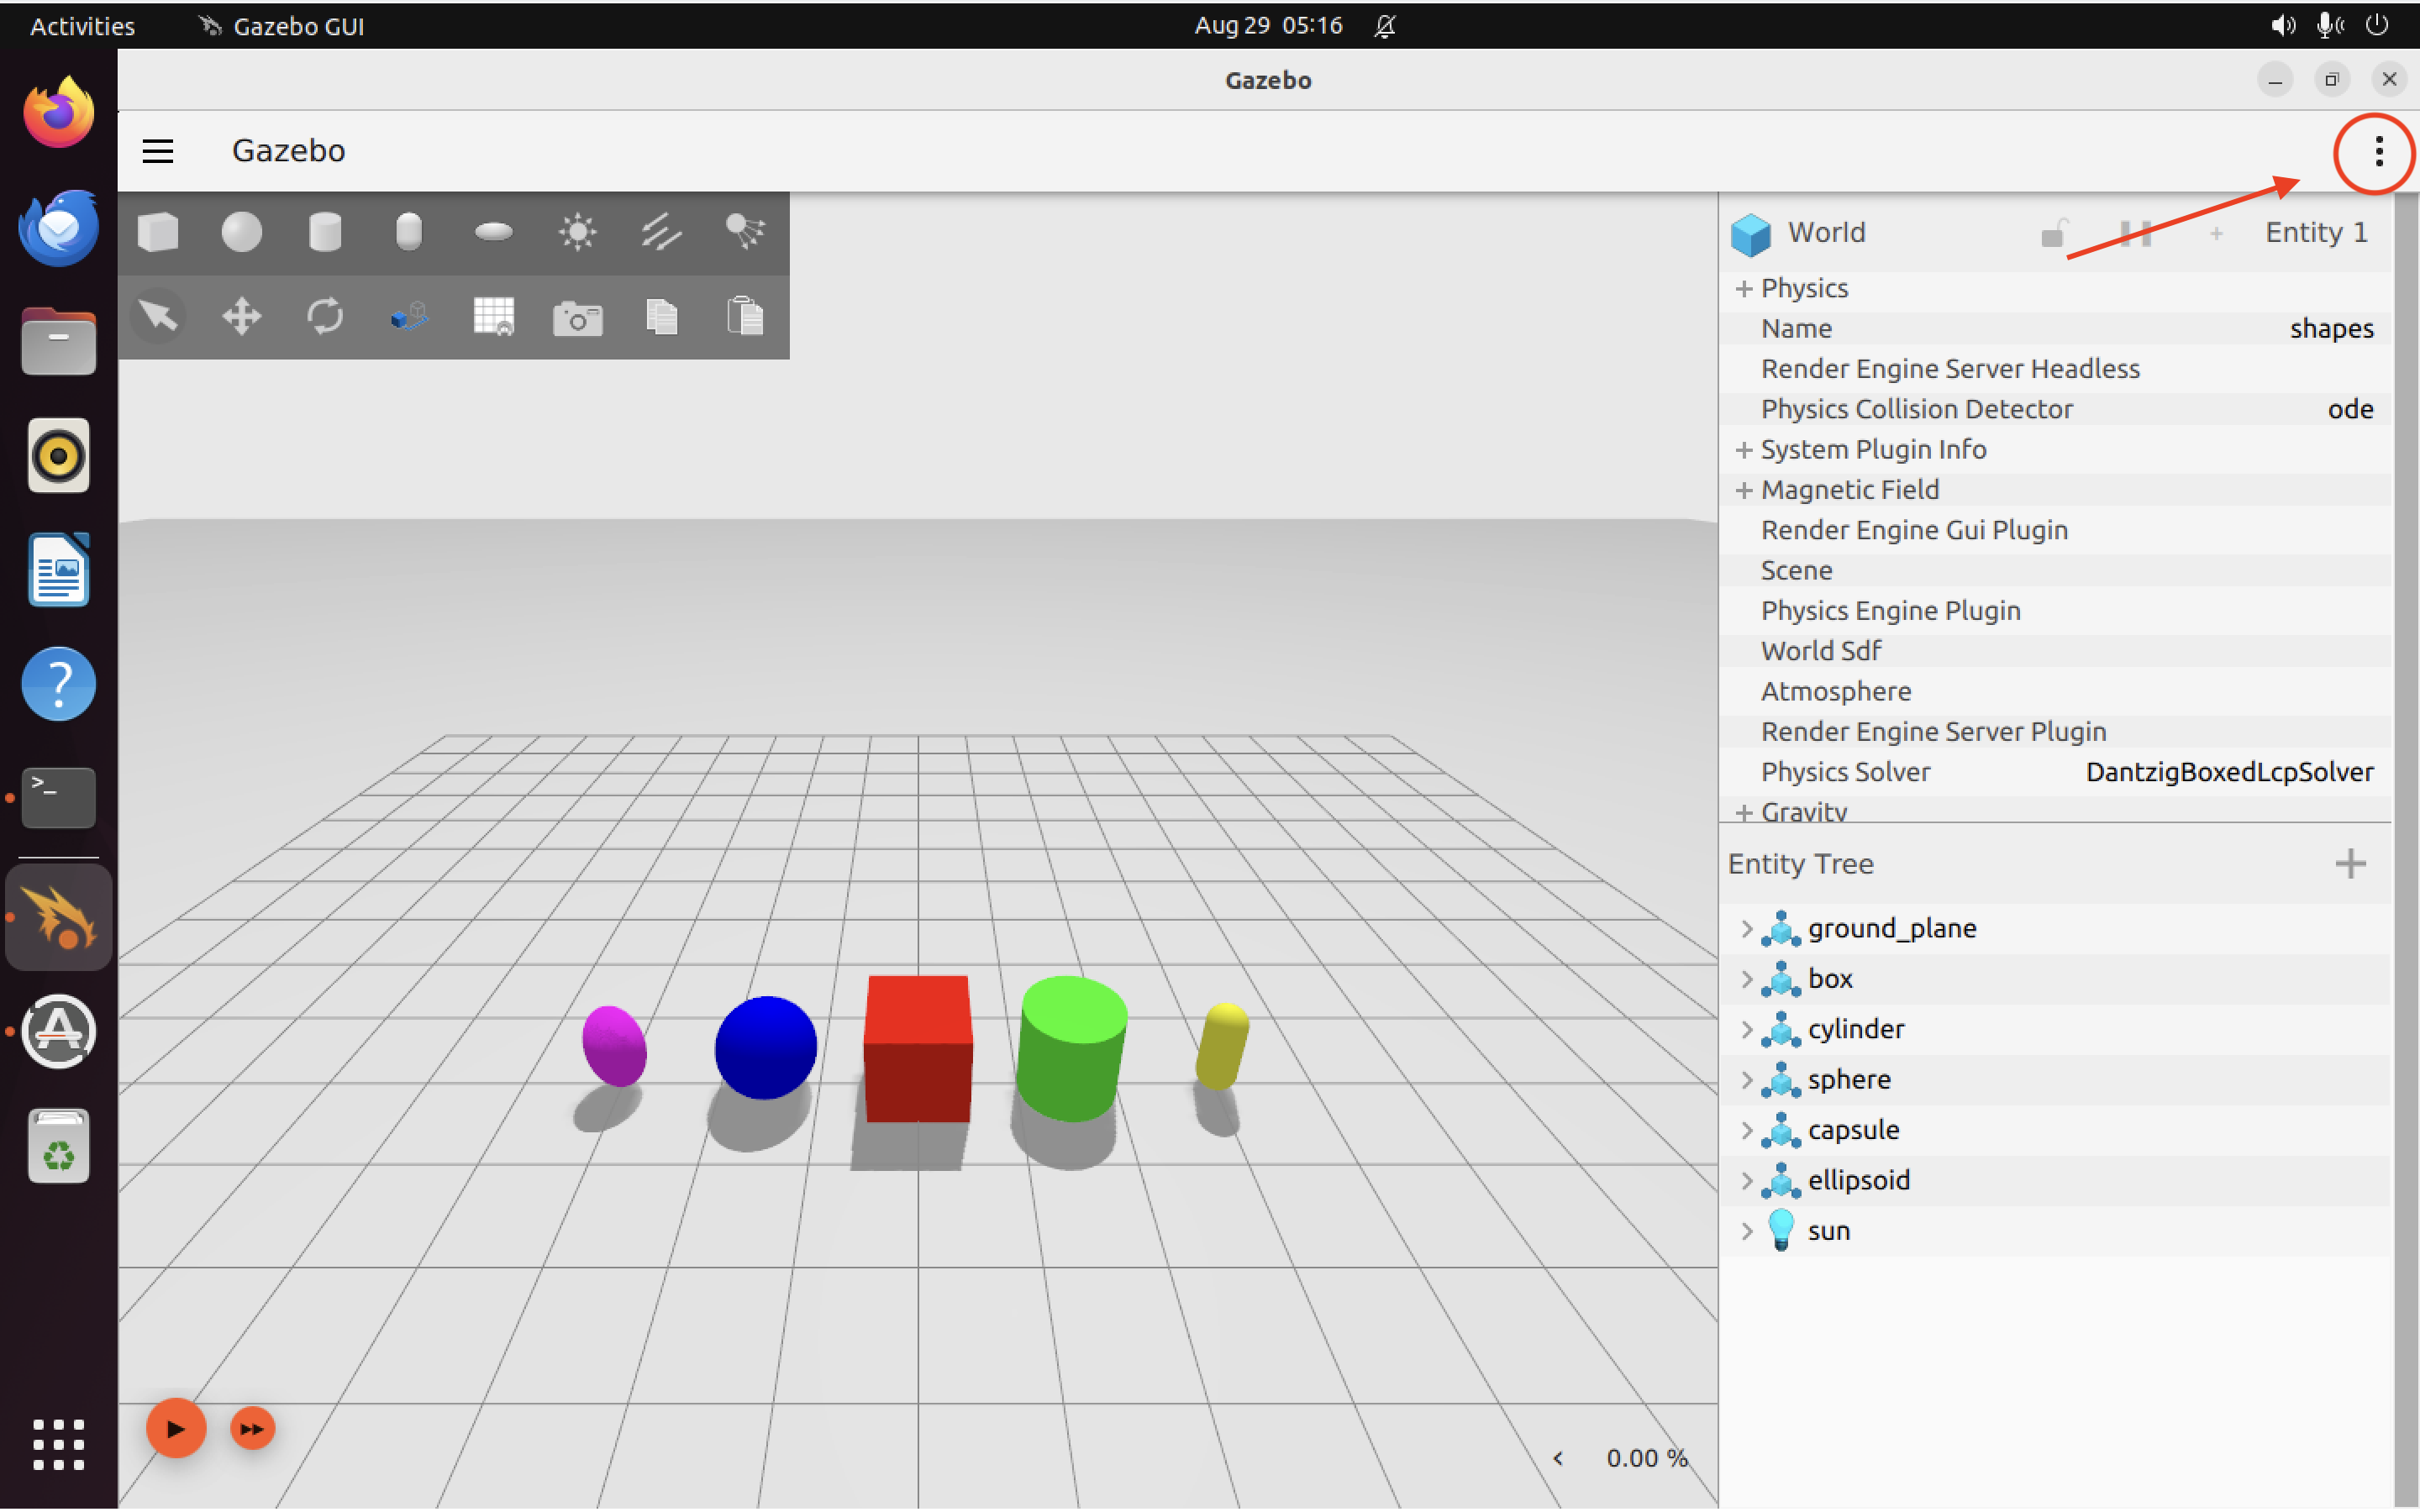
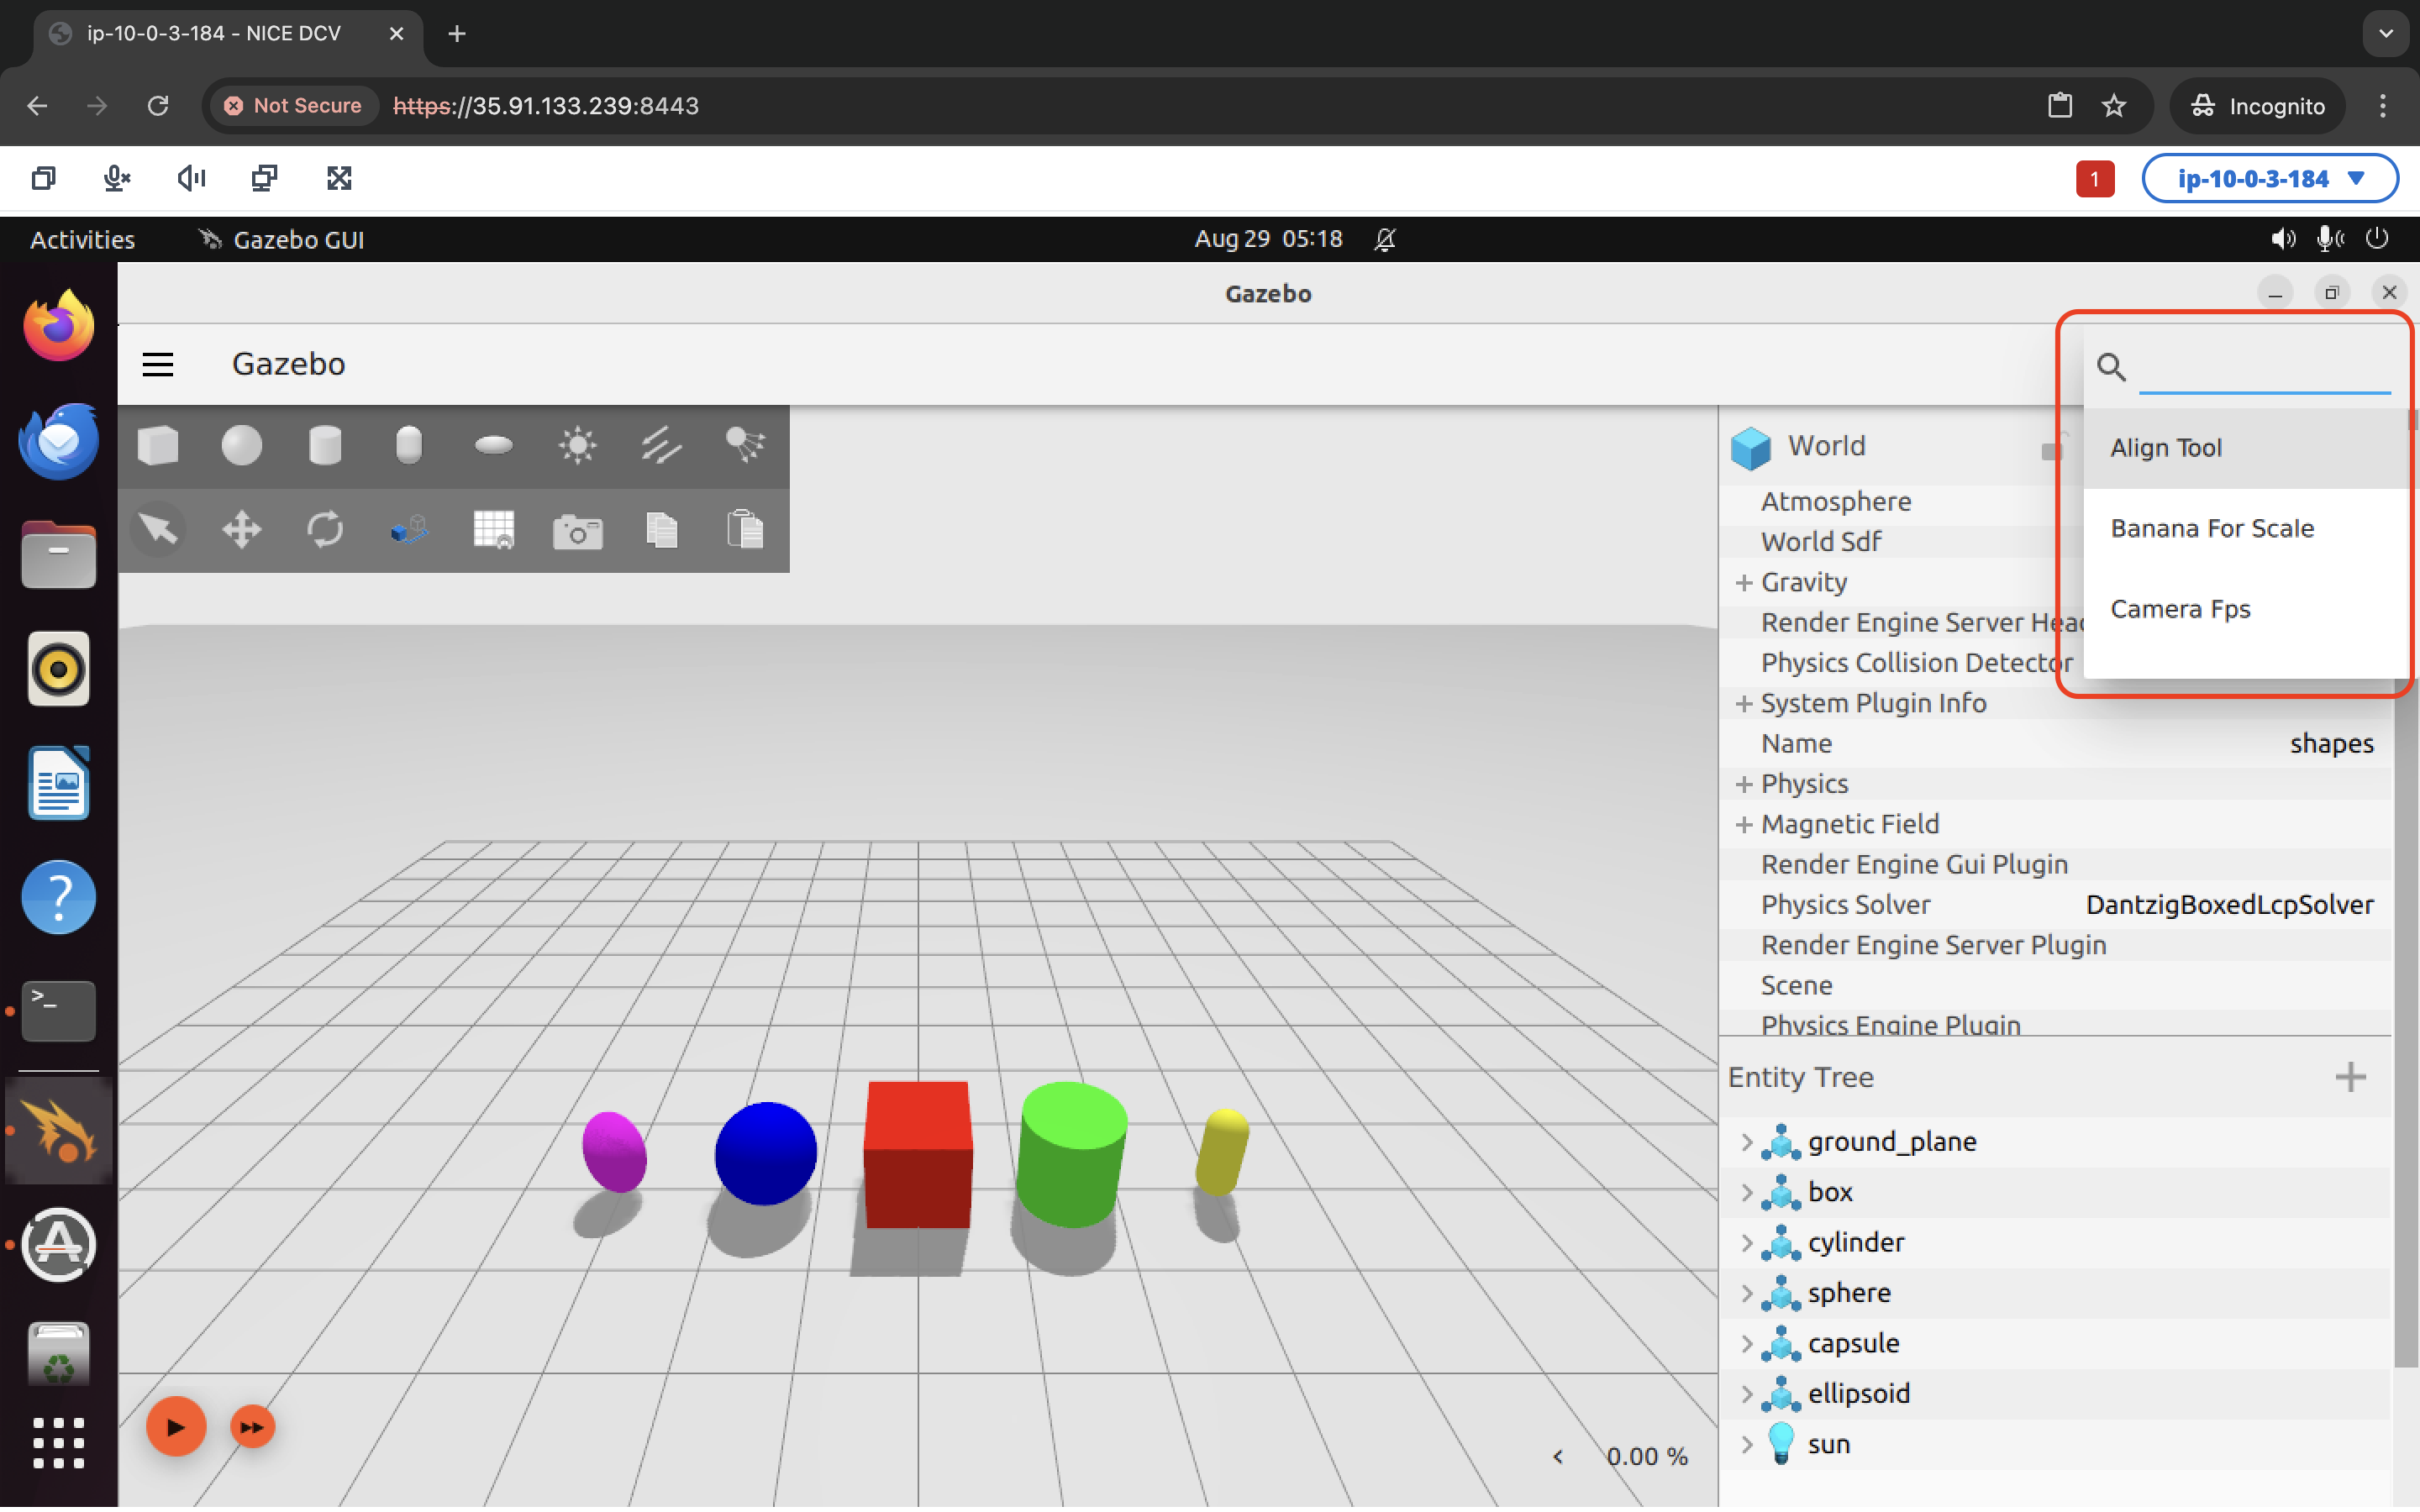
The rightmost menu (three vertical dots) allows you to use various Gazebo plugins (adding a plugin will usually add a new element to the GUI).
Just below the top menu bar is a shapes menu. This allows you to insert shapes into the world. The menu bar just below that allows you to manipuate shapes: moving, rotating, or otherwise transforming them. More on that in our next Gazebo tutorial.
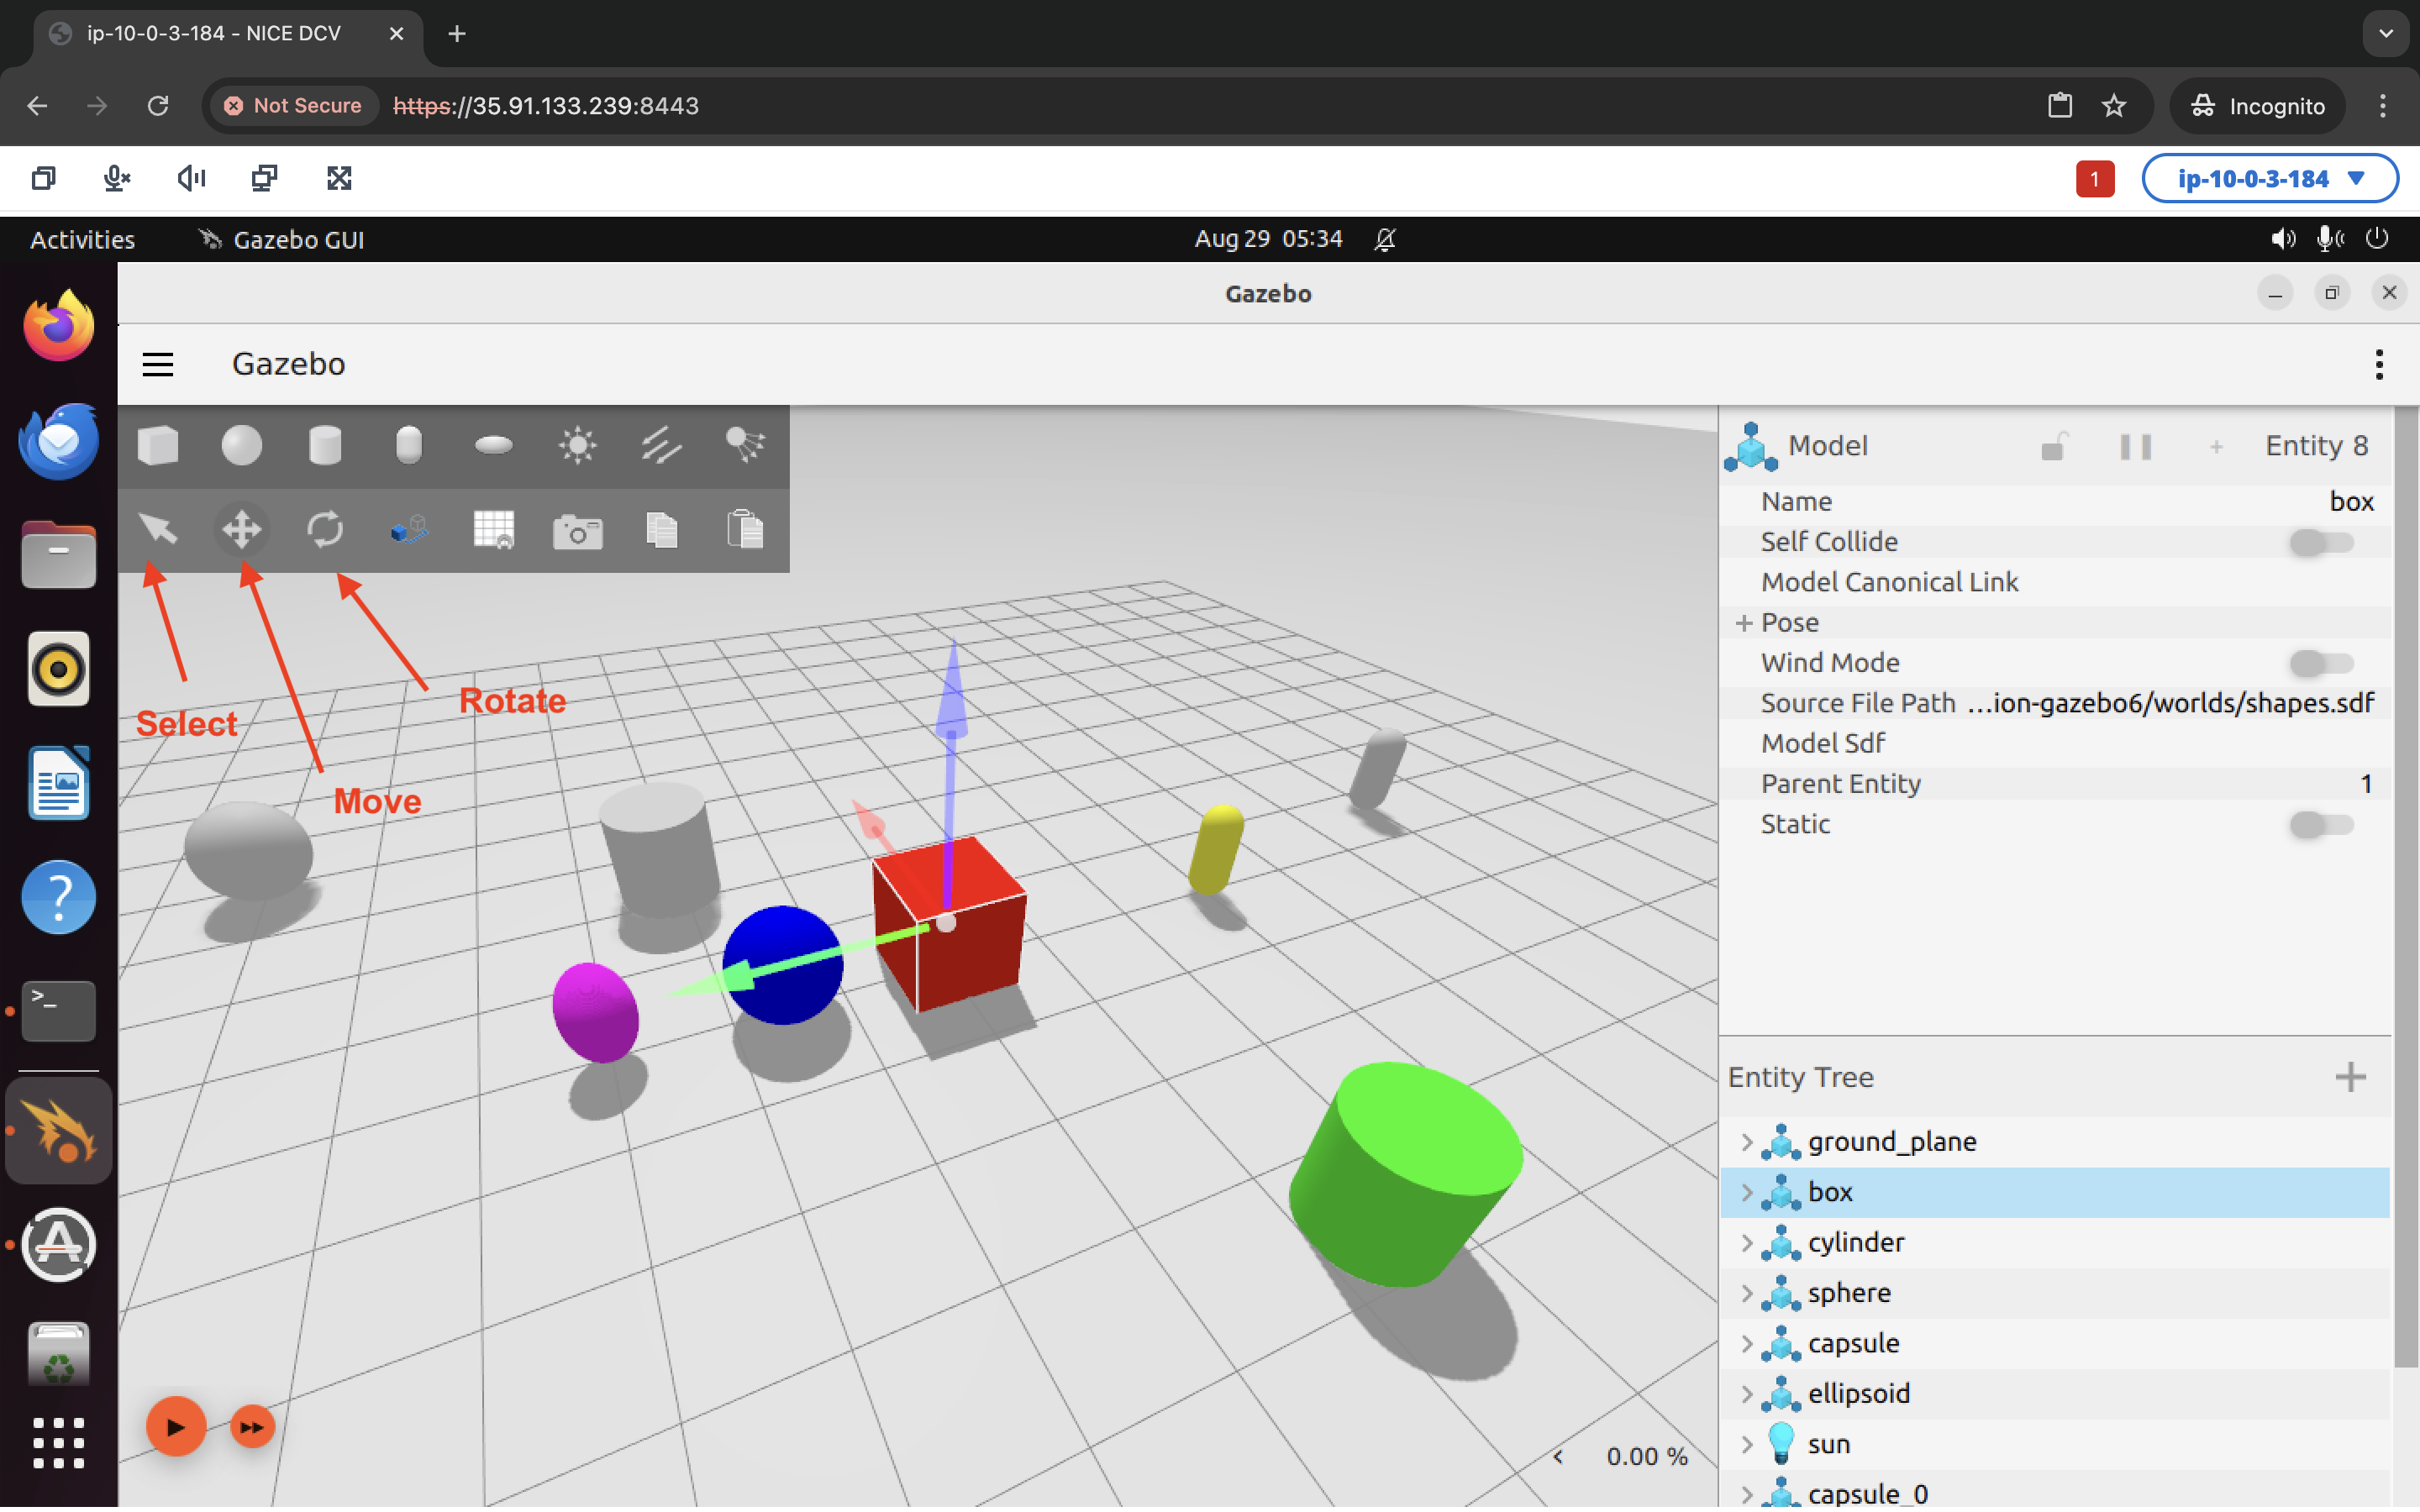
Note that because I have selected the “rotate” tool, my most recently selected shape now has X, Y, and Z axis indicators. I can click on those to drag the shape along one of those axes.
Right panel Link to heading
The right panel is where all your plugins will be. Right now we have two open:
- The Component Inspector (top)
- The Entity Tree (just underneath the Component Inspector)
The component will tell you about the properties of any item you have selcted in the scene.
The entity tree gives you a complete list of all the entities (things) that are part of your simulation. These would be the simulated items present in your .sdf file, such as the ground plane, the shapes, and the sun (light source).

Note: You can also right click on any of the plugin windows to adjust its properties or close it.
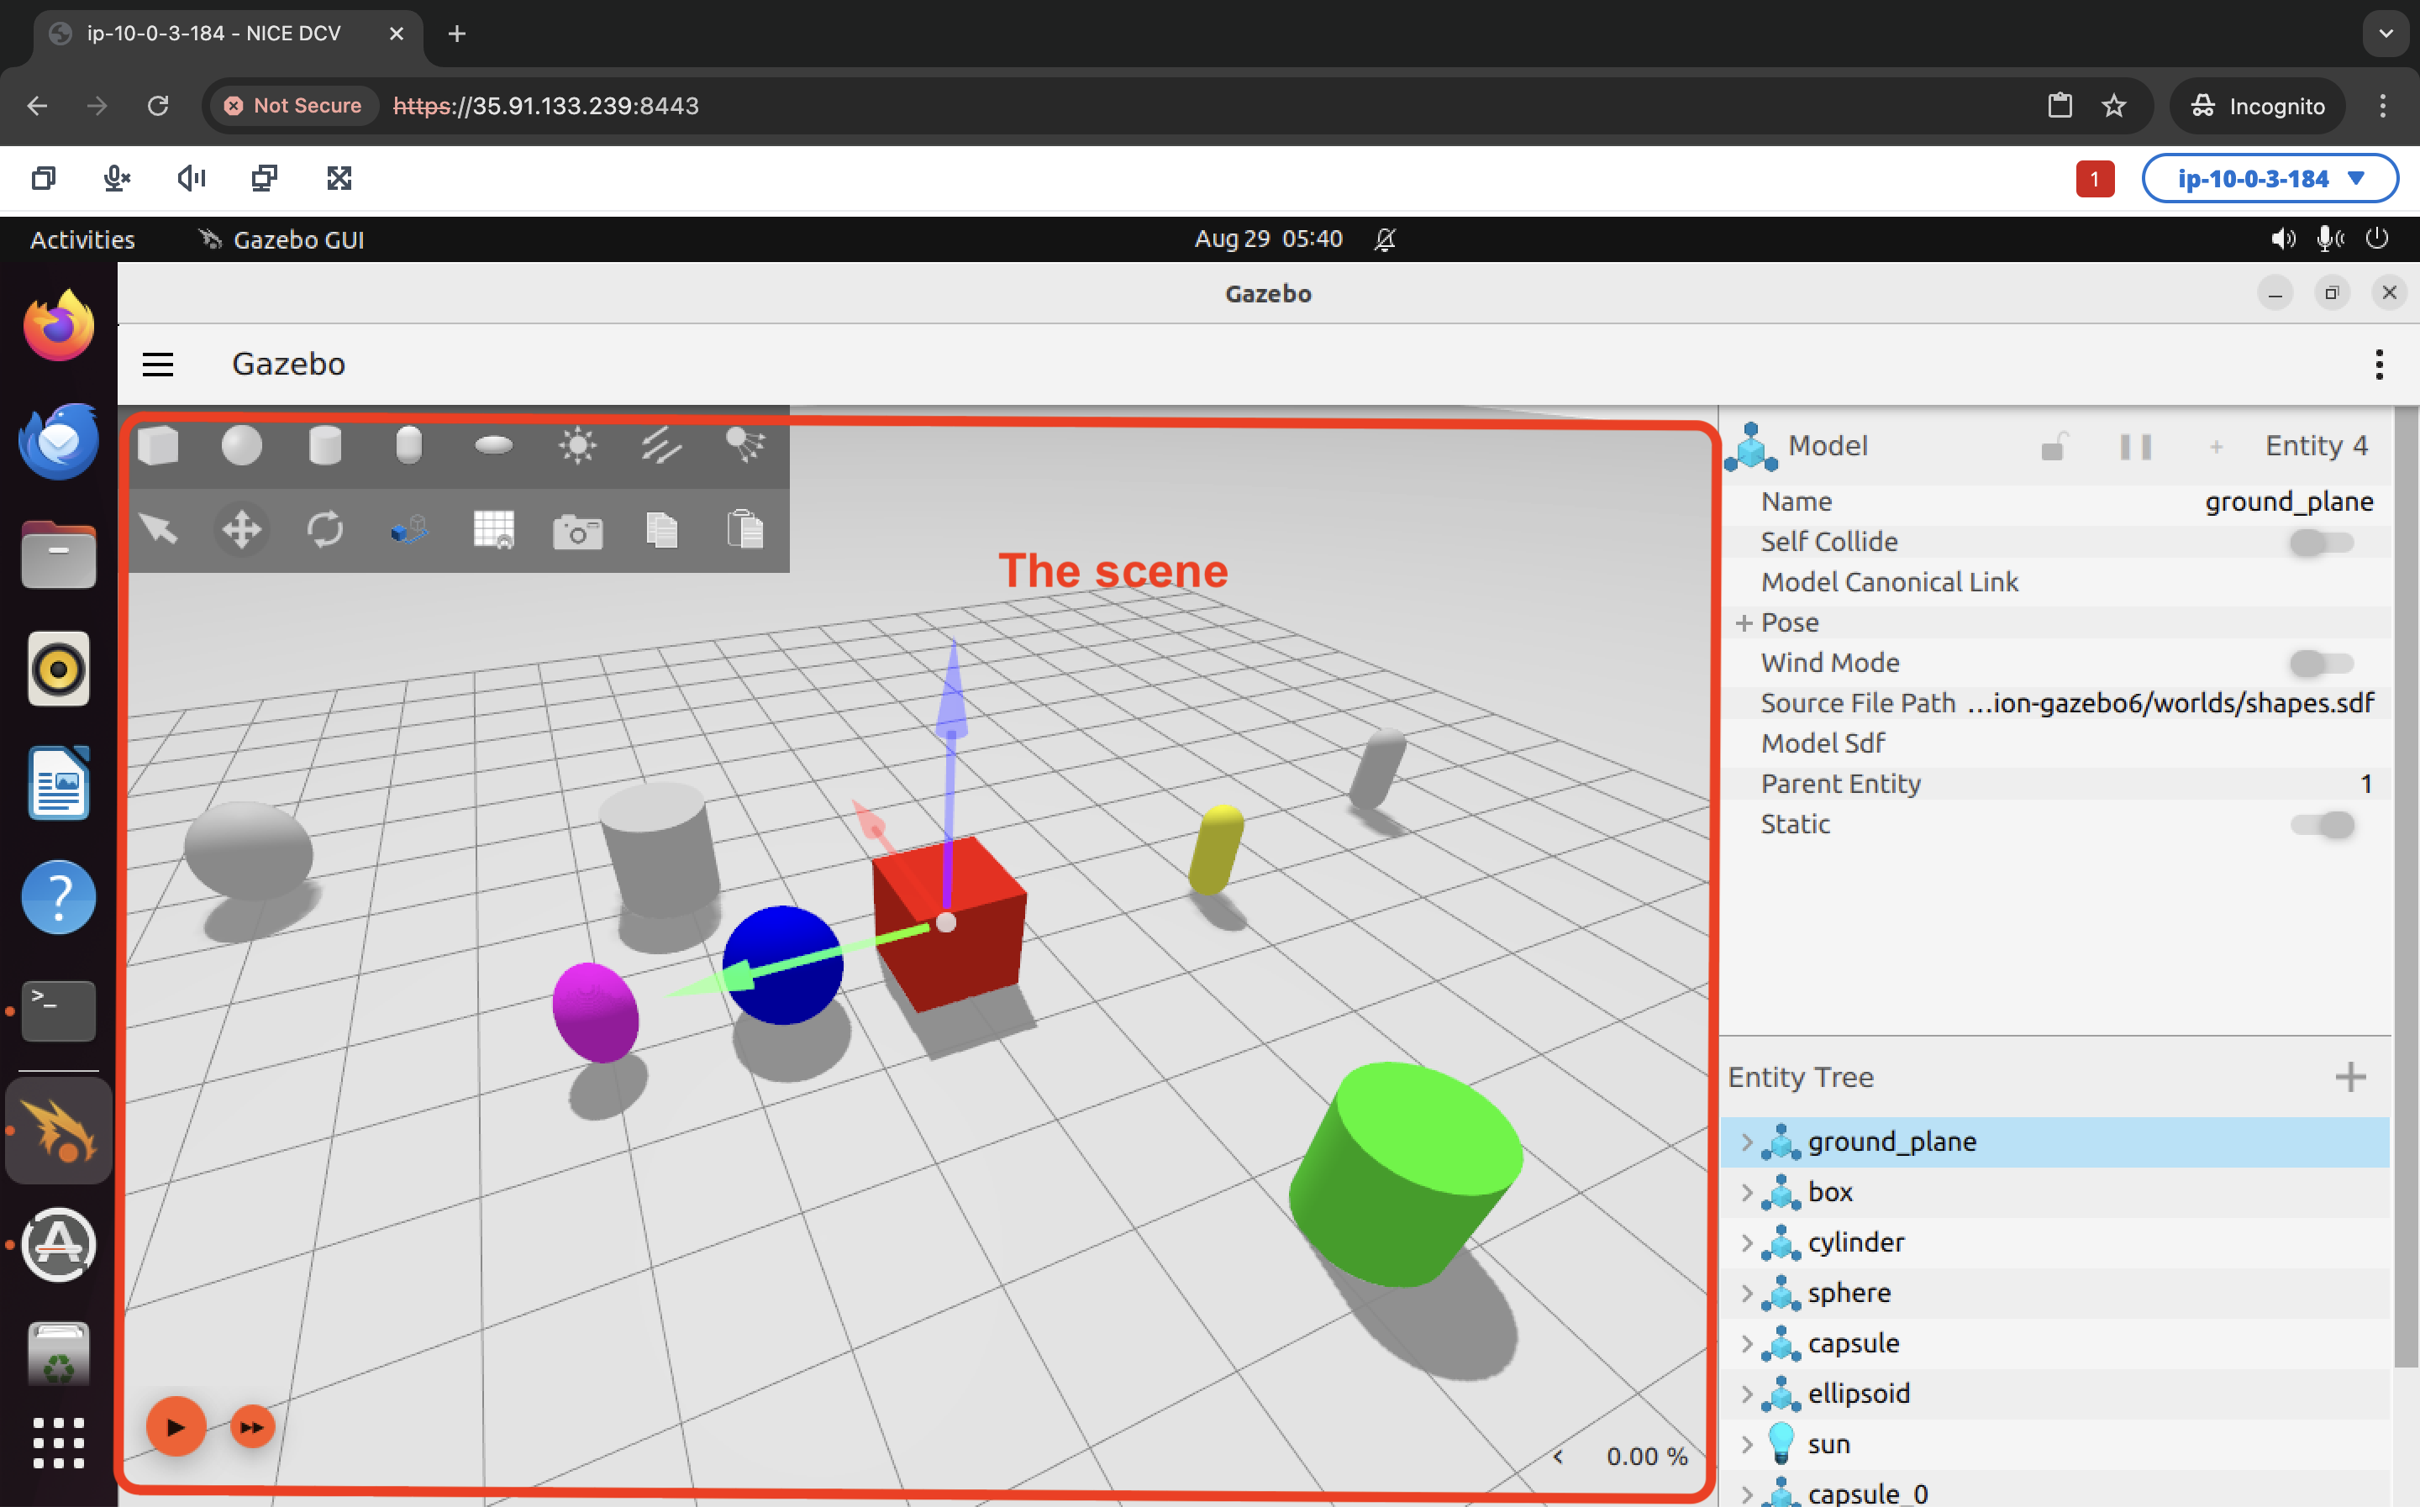
The scene Link to heading
The scene lets you manipulate your simulated world and interact with the objects it contains. Here’s what you can do in the scene view, according to the official docs:
- Left-click: select entity
- Right-click: opens menu with options: > - Move to: center the scene on an entity > - Follow: choose an entity for the view to stay centered on, whether it moves or you pan around > - Remove: erase the entity from the simulation > - View > Collisions: view collisions of the entity (that are defined in the SDF file)
- Left-click and drag: pan around the scene
- Right-click and drag: zoom in and out
- Scroll wheel forward/backward: zoom in and out
- Scroll wheel click and drag: rotate the scene
World control Link to heading
At the very bottom of the window is the “world control”, consisting of a Play/Pause button, a Steps (“fast forward”) button, and an RTF (Real time factor) indicator (far right corner):
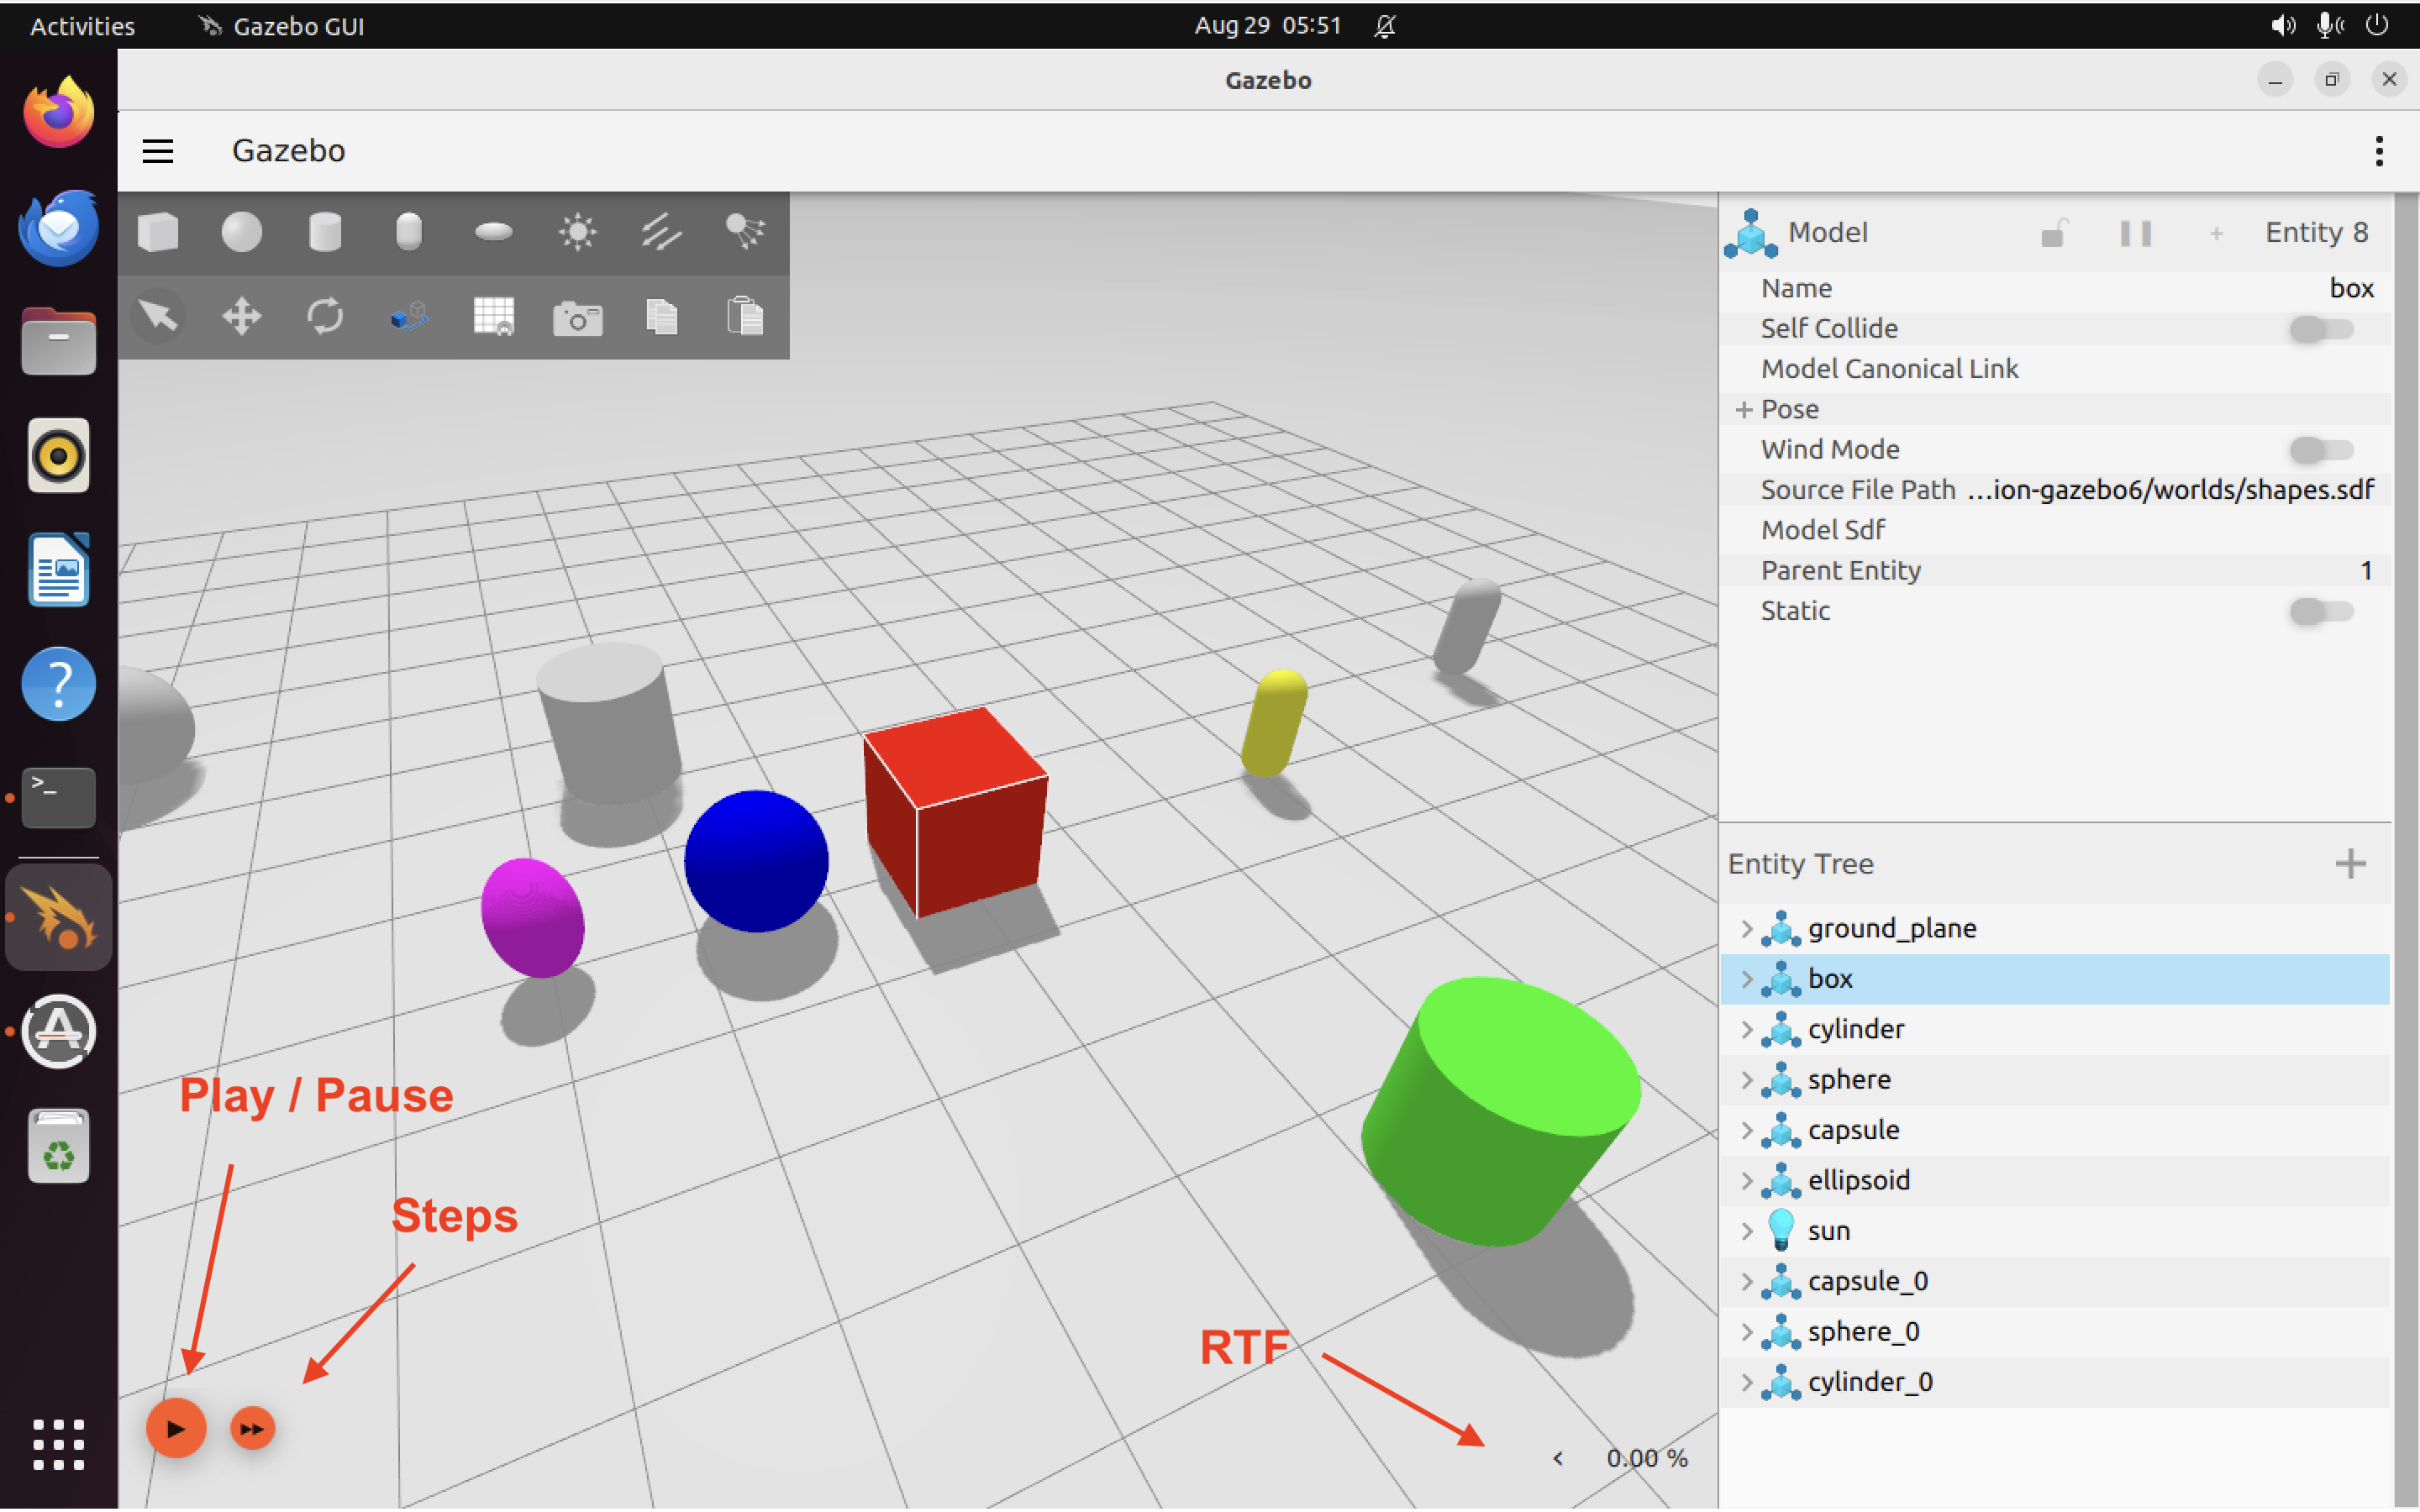
Hitting the play button will start the simulation. Hitting it again will pause the simulation.
You can hover over the Steps button to customize the “step size” (rate at which the simulator steps through simulated time).
Clicking the little tiny “<” arrow next to the RTF display will expand the view to show additional details about the simulation.
Here’s the simulatino running, with the RTF stats expanded:
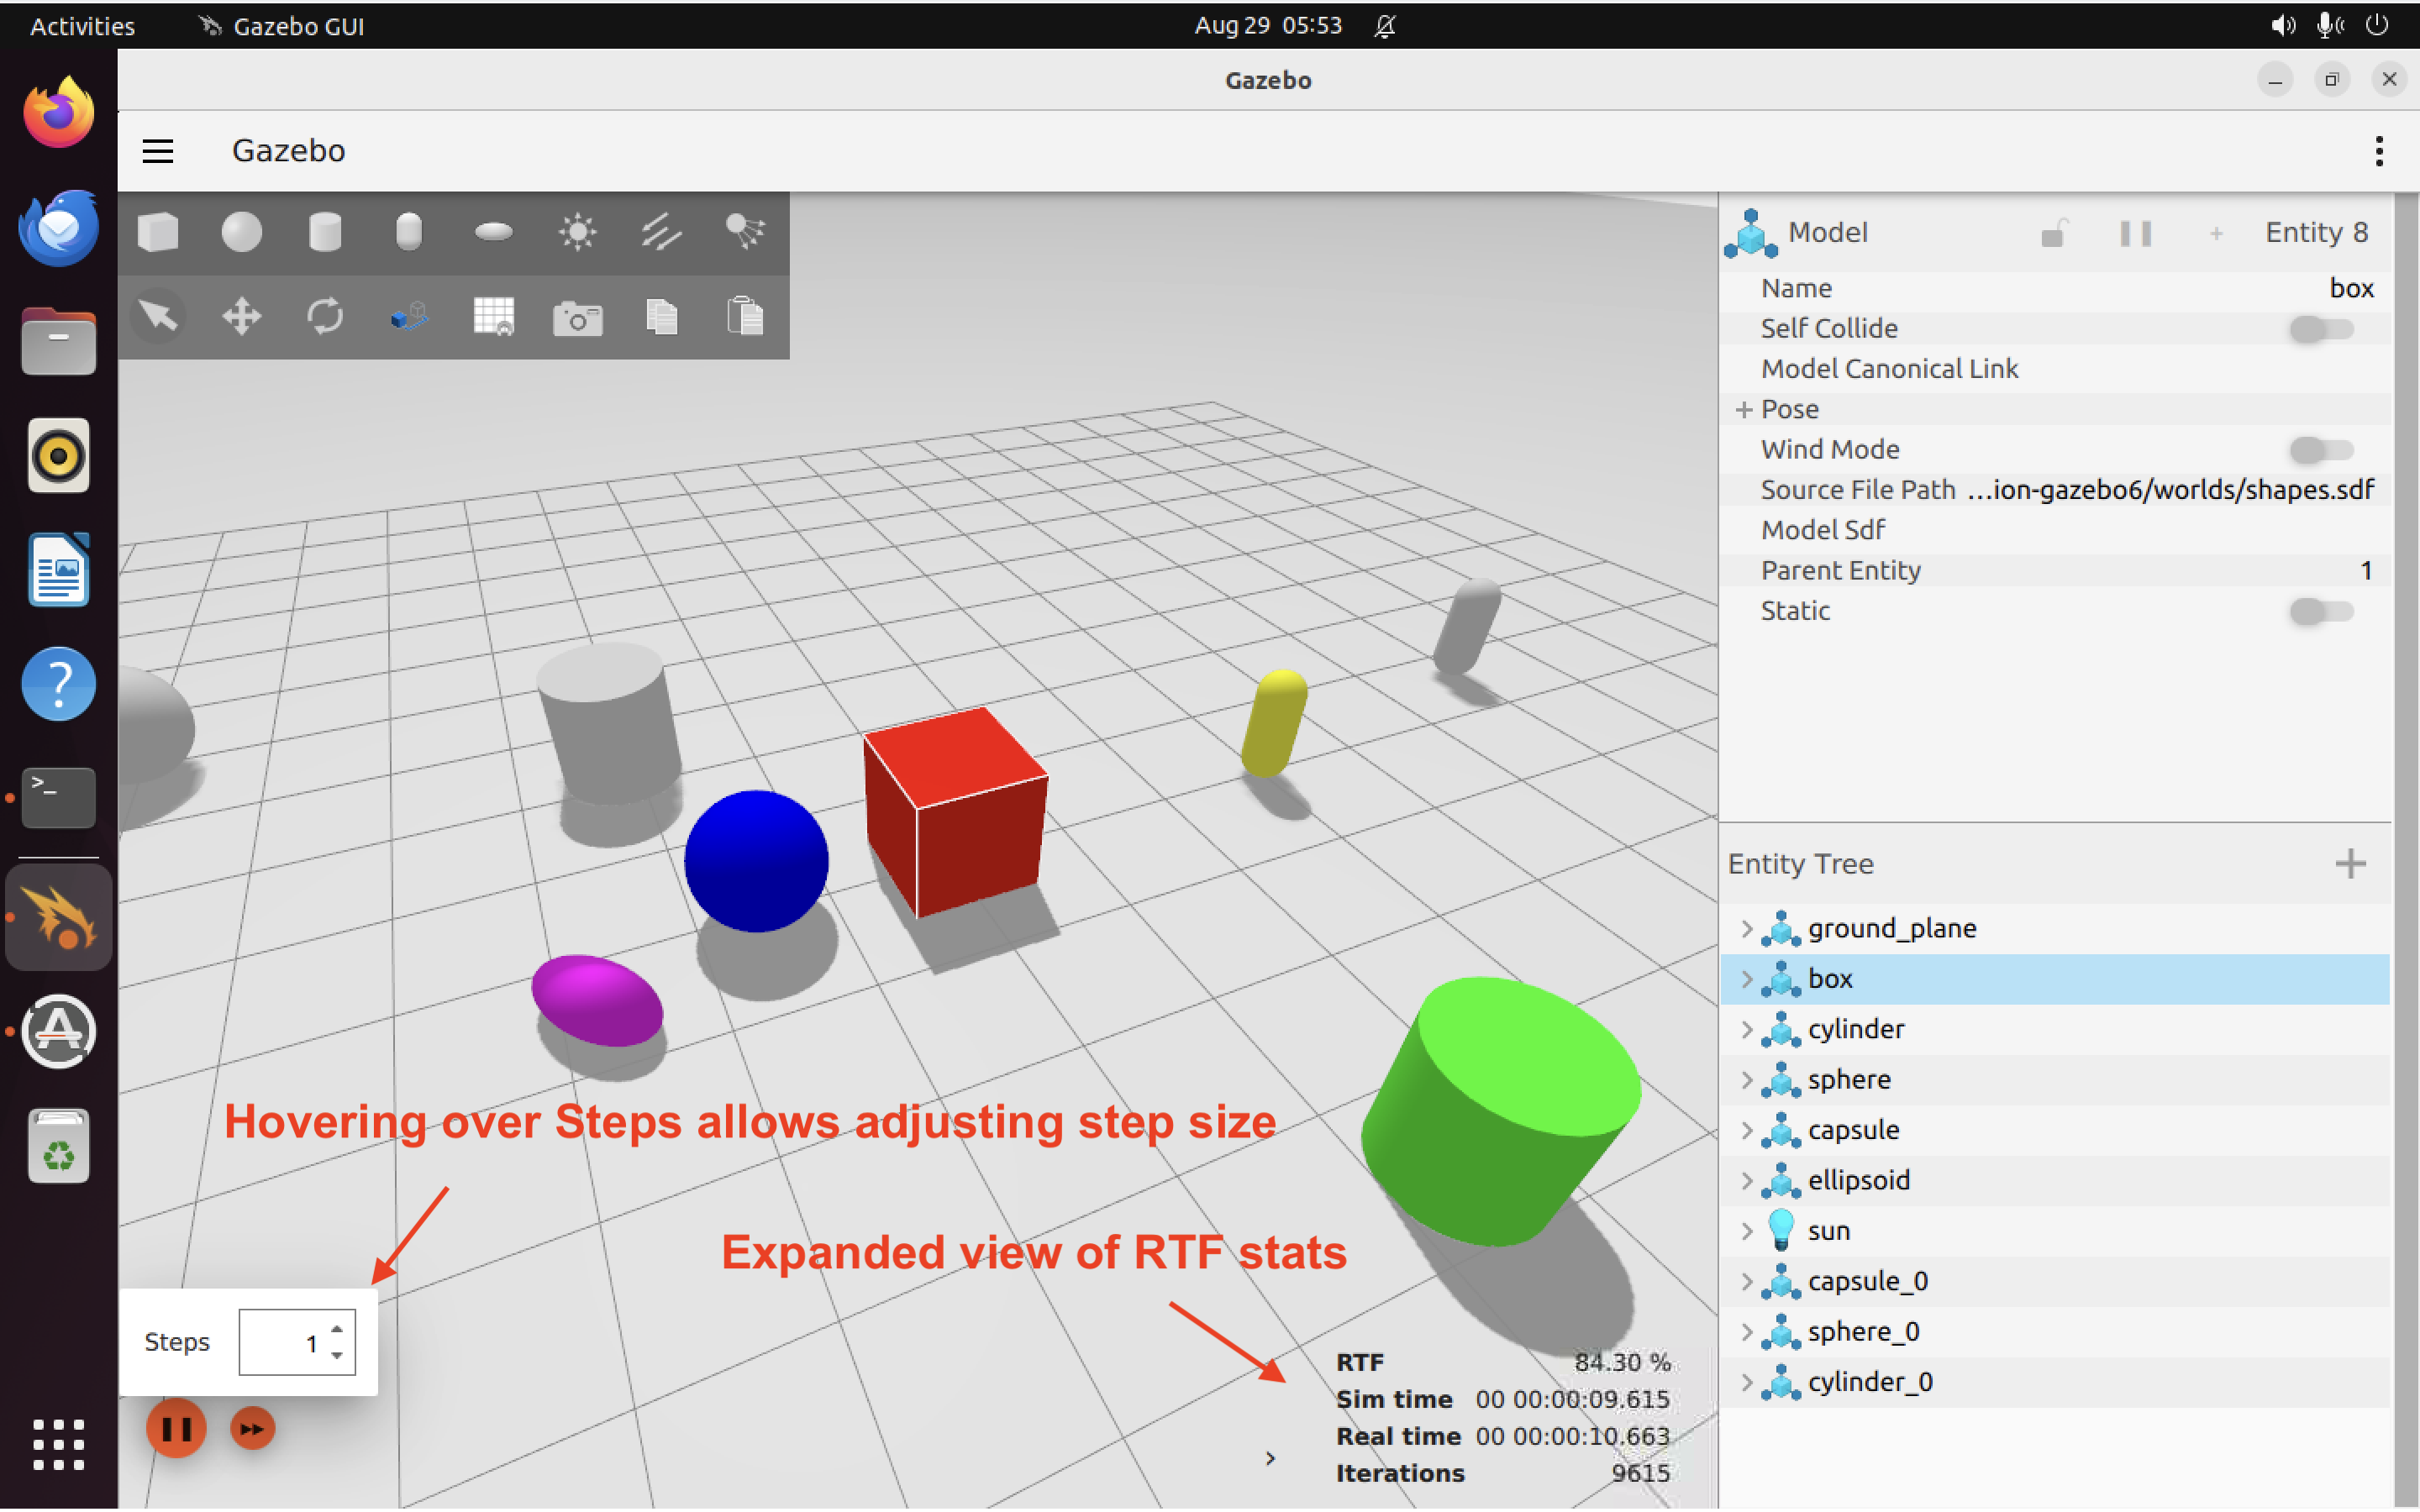
Note that the simulation does not necessarily run in 1:1 lock step with real time. Depending on the complexity of what’s happening in the simulation, it make take more (or less) than 1 second of real time to simulate 1 second of simulated time. You’ll notice that with a step size of 1, the RTF is actually fluctuating around 100%. Sometimes it’s faster than real time, sometimes its slower.
Awesome! That’s it for today. See you next time. ^_^